Early Detection of Cardiovascular Disease with Interpretable ML
An ensemble machine learning system trained on NHANES 2017-2018 — the CDC's nationally
representative population health survey — delivering calibrated CVD risk scores with
SHAP-powered explanations for every prediction.
5,569
Adults Analyzed
0.800
Best AUROC
19
Clinical Features
5+1
Models in Ensemble
Dataset
NHANES 2017-2018 — CDC National Health and Nutrition Examination Survey
Why NHANES?
10x
Larger than the standard UCI Heart Disease dataset (9,254 participants vs ~303)
Data Modalities
4
Interview + Physical Exam + Laboratory + Questionnaire — all merged by participant ID
CVD Cases
631
Self-reported coronary heart disease, angina, heart attack, or stroke in adults 20+
Features Engineered
19
Including Pulse Pressure, Chol/HDL Ratio, and computed Framingham Risk Score
Class Imbalance Fix
SMOTE
Synthetic Minority Oversampling balances training set to 50/50 without data leakage
Representativeness
US
Nationally representative via CDC complex sampling — not limited to hospital patients
Model Performance
6 classifiers trained on SMOTE-balanced data, evaluated on held-out 20% test set (n=1,114)
AUROC — Area Under ROC Curve
Random Forest
0.800
Logistic Regression
0.800
Ensemble
0.794
Gradient Boosting
0.786
XGBoost
0.782
LightGBM
0.781
Framingham Score
~0.73
Model
AUROC
AUPRC
F1 Score
Brier Score
Notes
Random Forest
0.8002
0.3127
0.3418
0.1166
Best AUROC
Logistic Regression
0.7996
0.3029
0.3811
0.1780
Best F1
Ensemble (soft vote)
0.7937
0.3106
0.3234
0.1018
Best Brier
Gradient Boosting
0.7863
0.3040
0.2954
0.1036
XGBoost
0.7819
0.2855
0.2897
0.1021
LightGBM
0.7806
0.3103
0.3070
0.1002
Lowest Brier
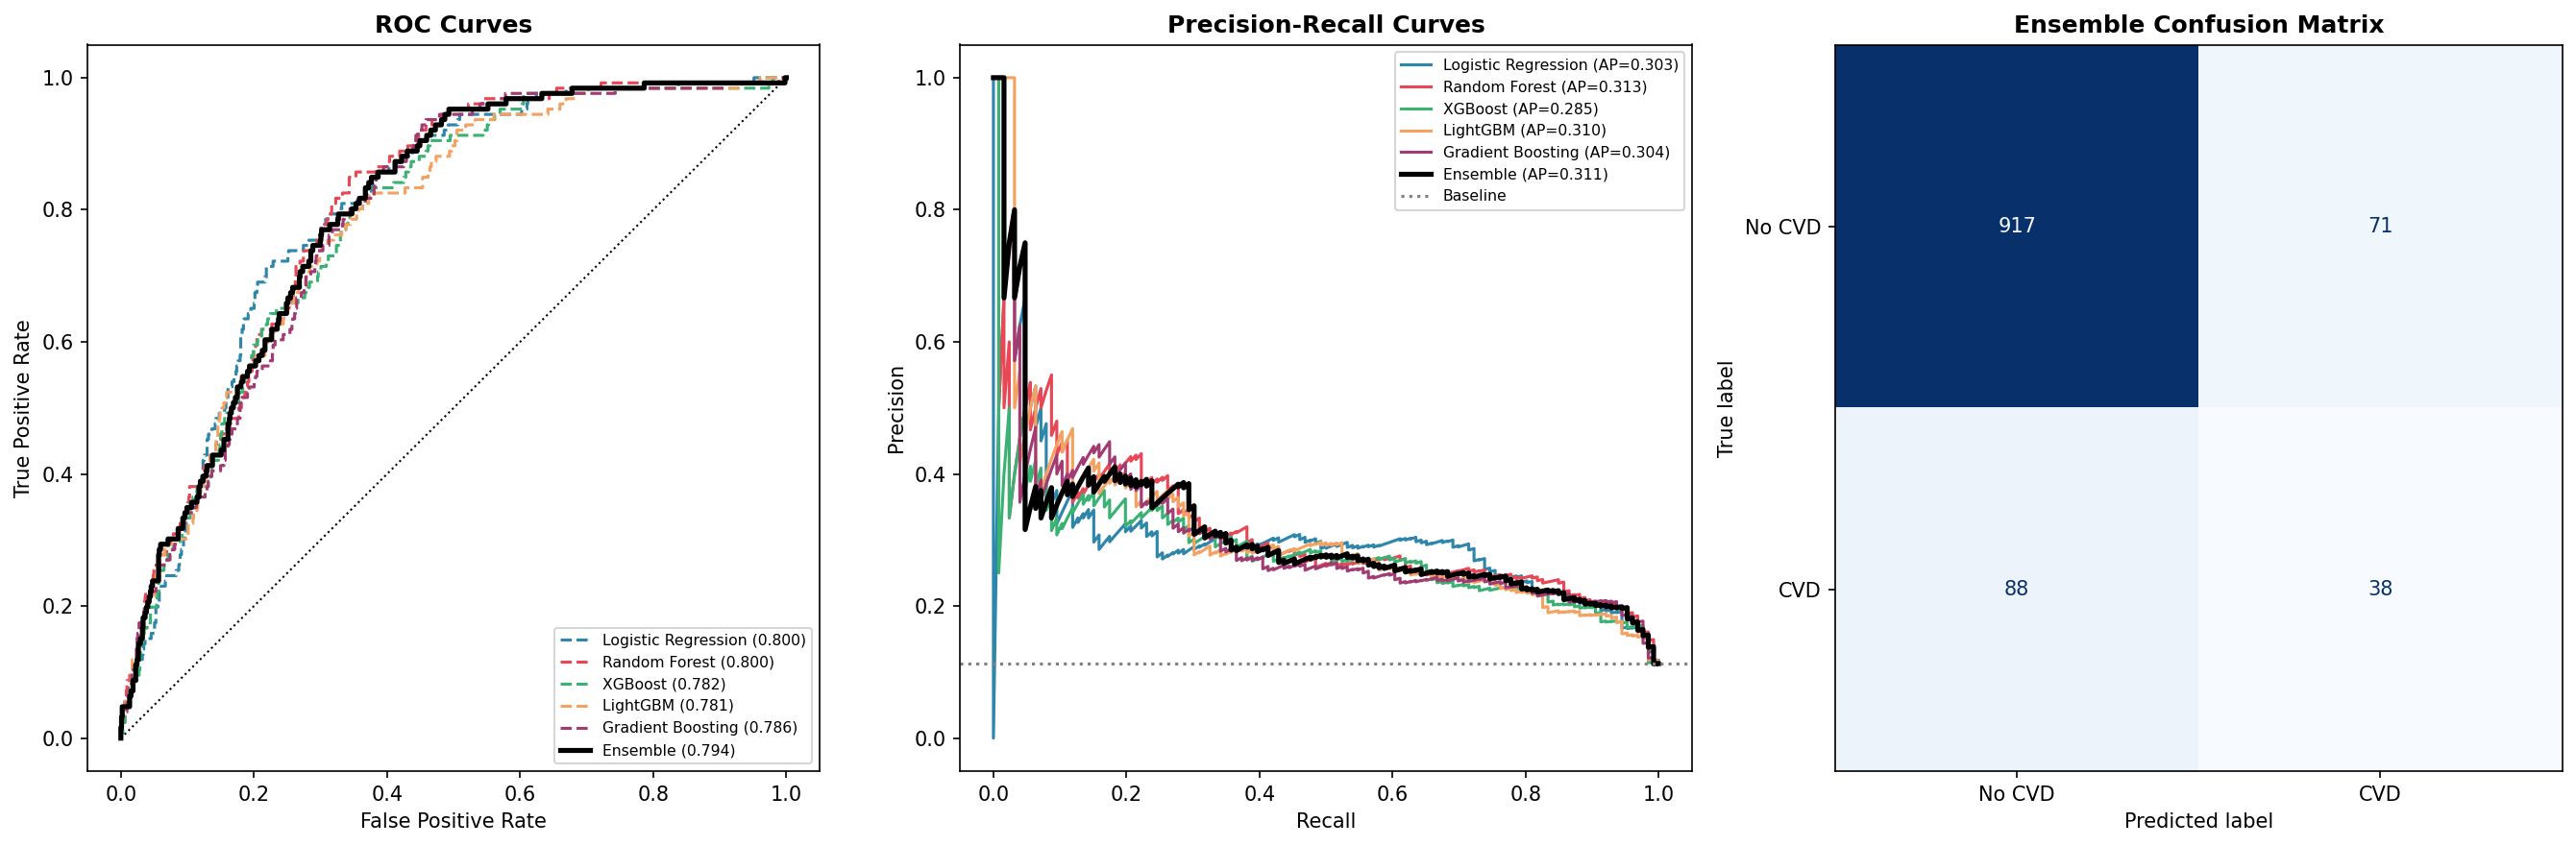
ROC curves, Precision-Recall curves, and Ensemble confusion matrix
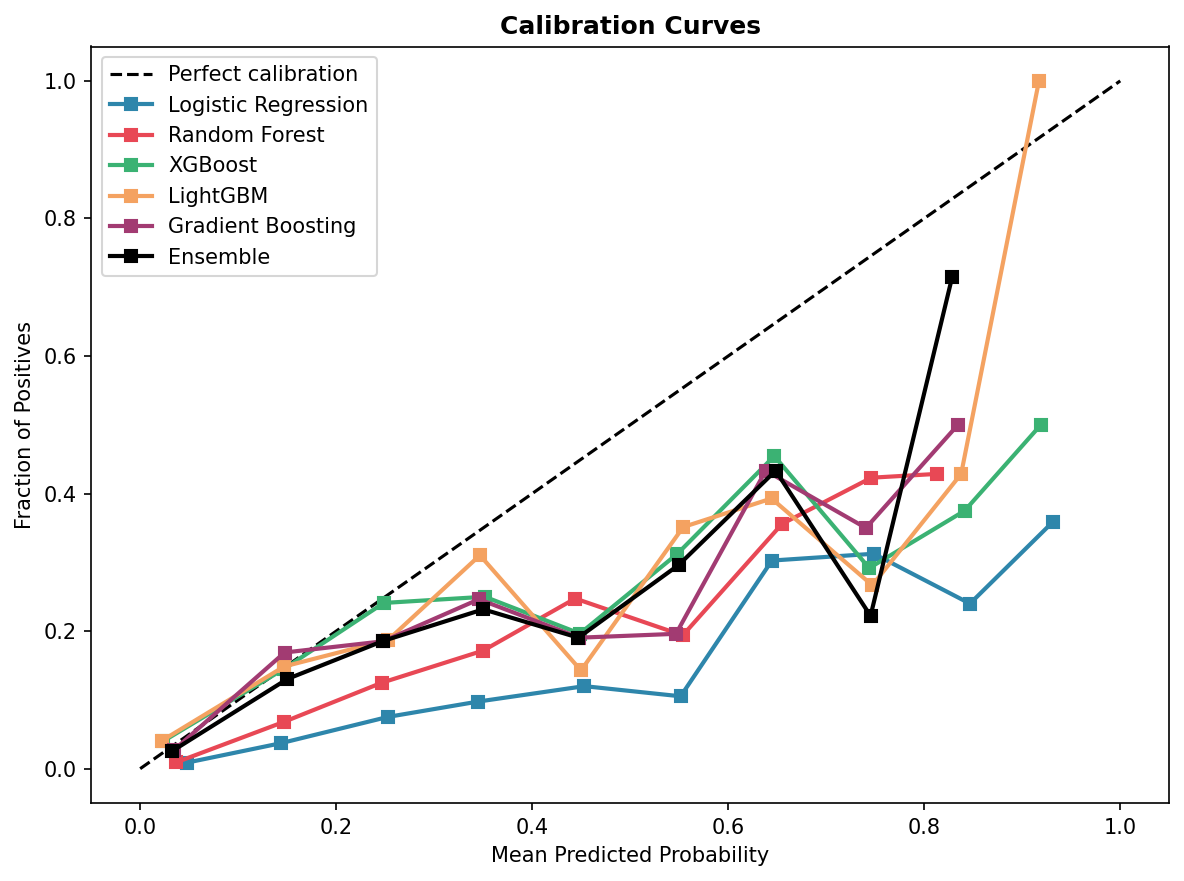
Calibration curves — Ensemble tracks the diagonal closely (well-calibrated)
Exploratory Analysis
Understanding the population before modeling
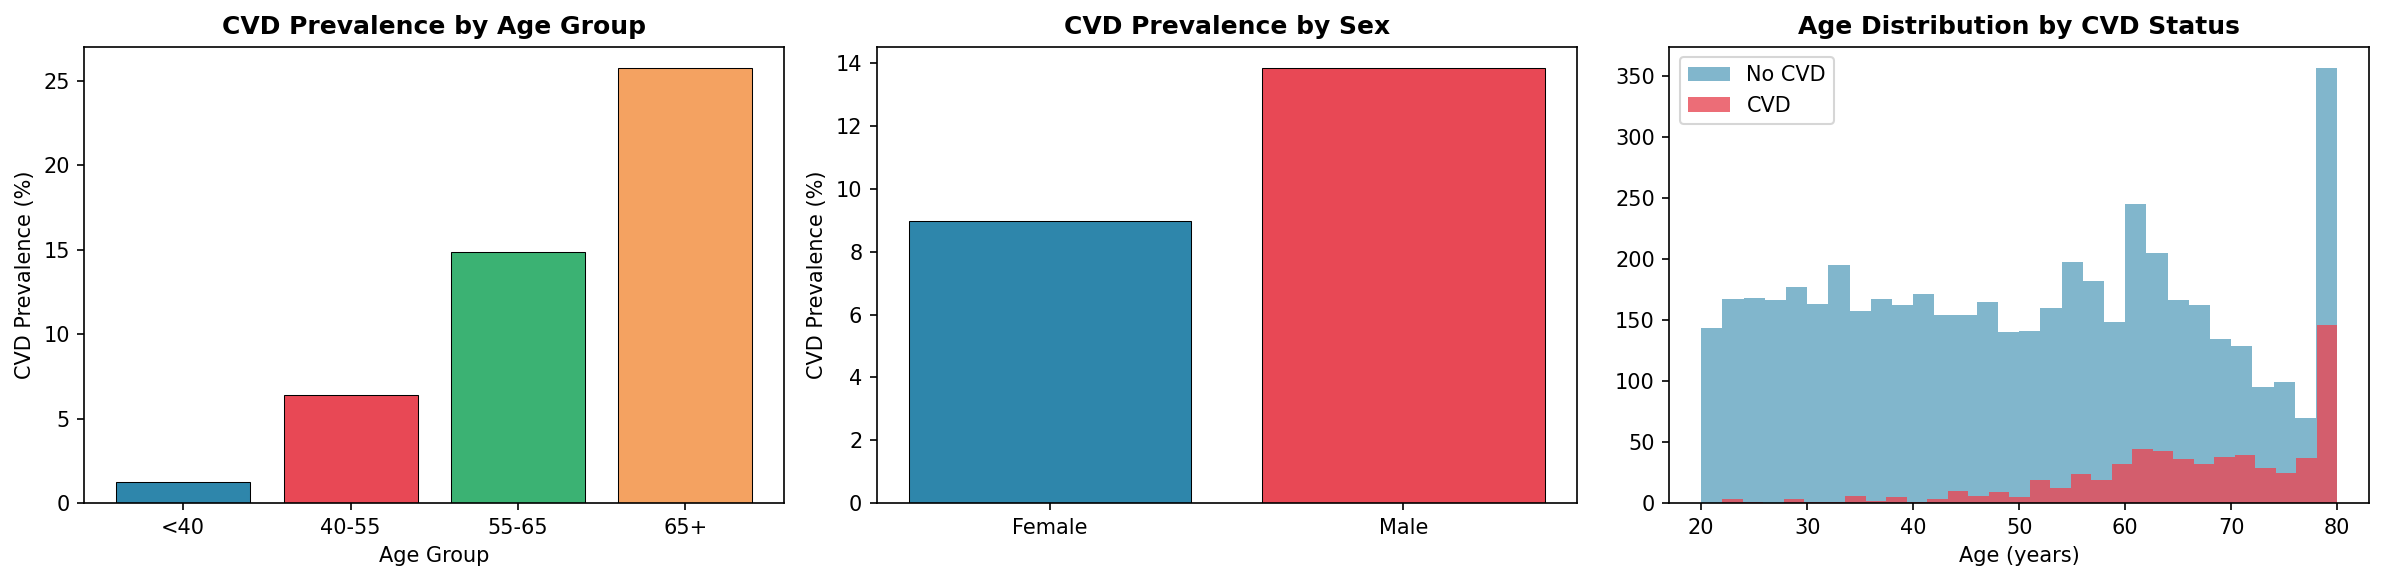
CVD prevalence by age group and sex; age distribution by CVD status
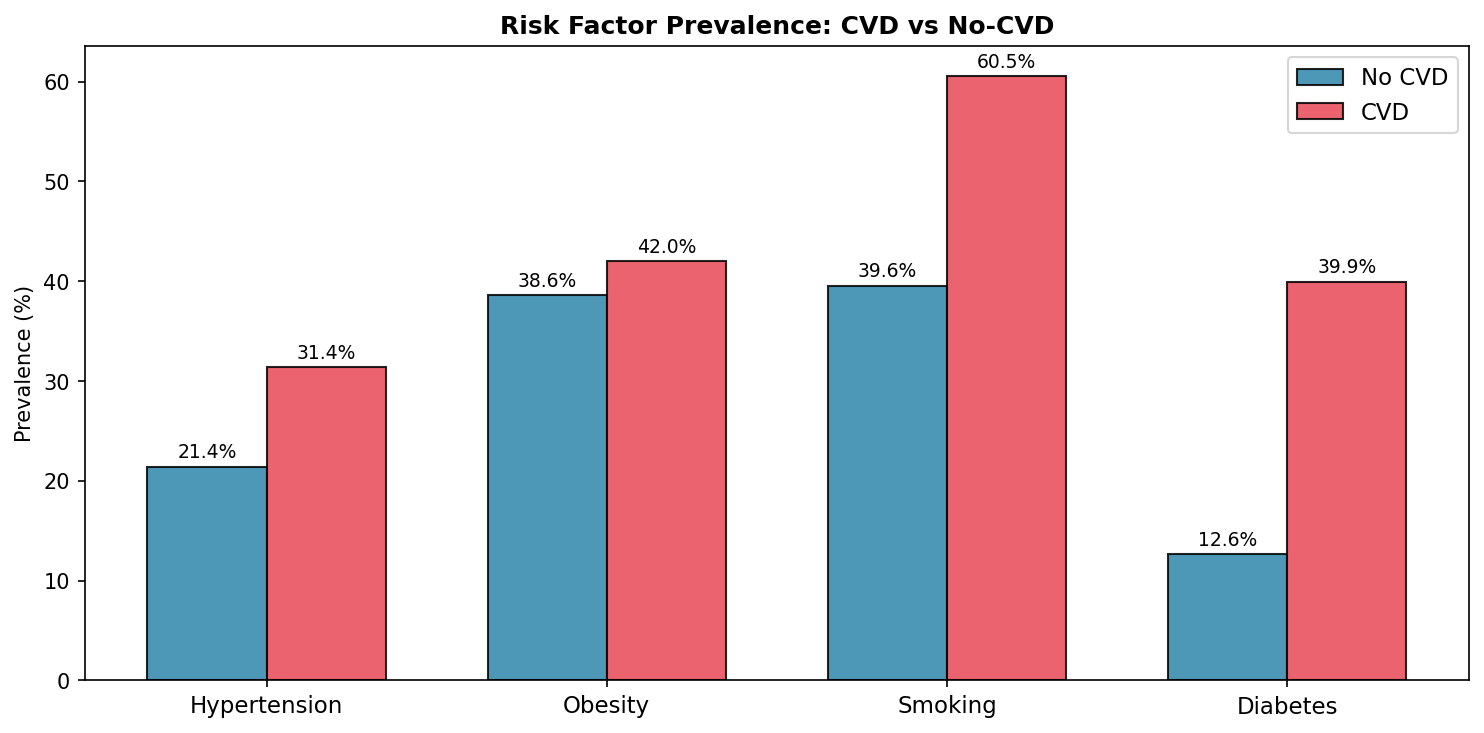
Risk factor prevalence — CVD patients show significantly higher rates across all four factors
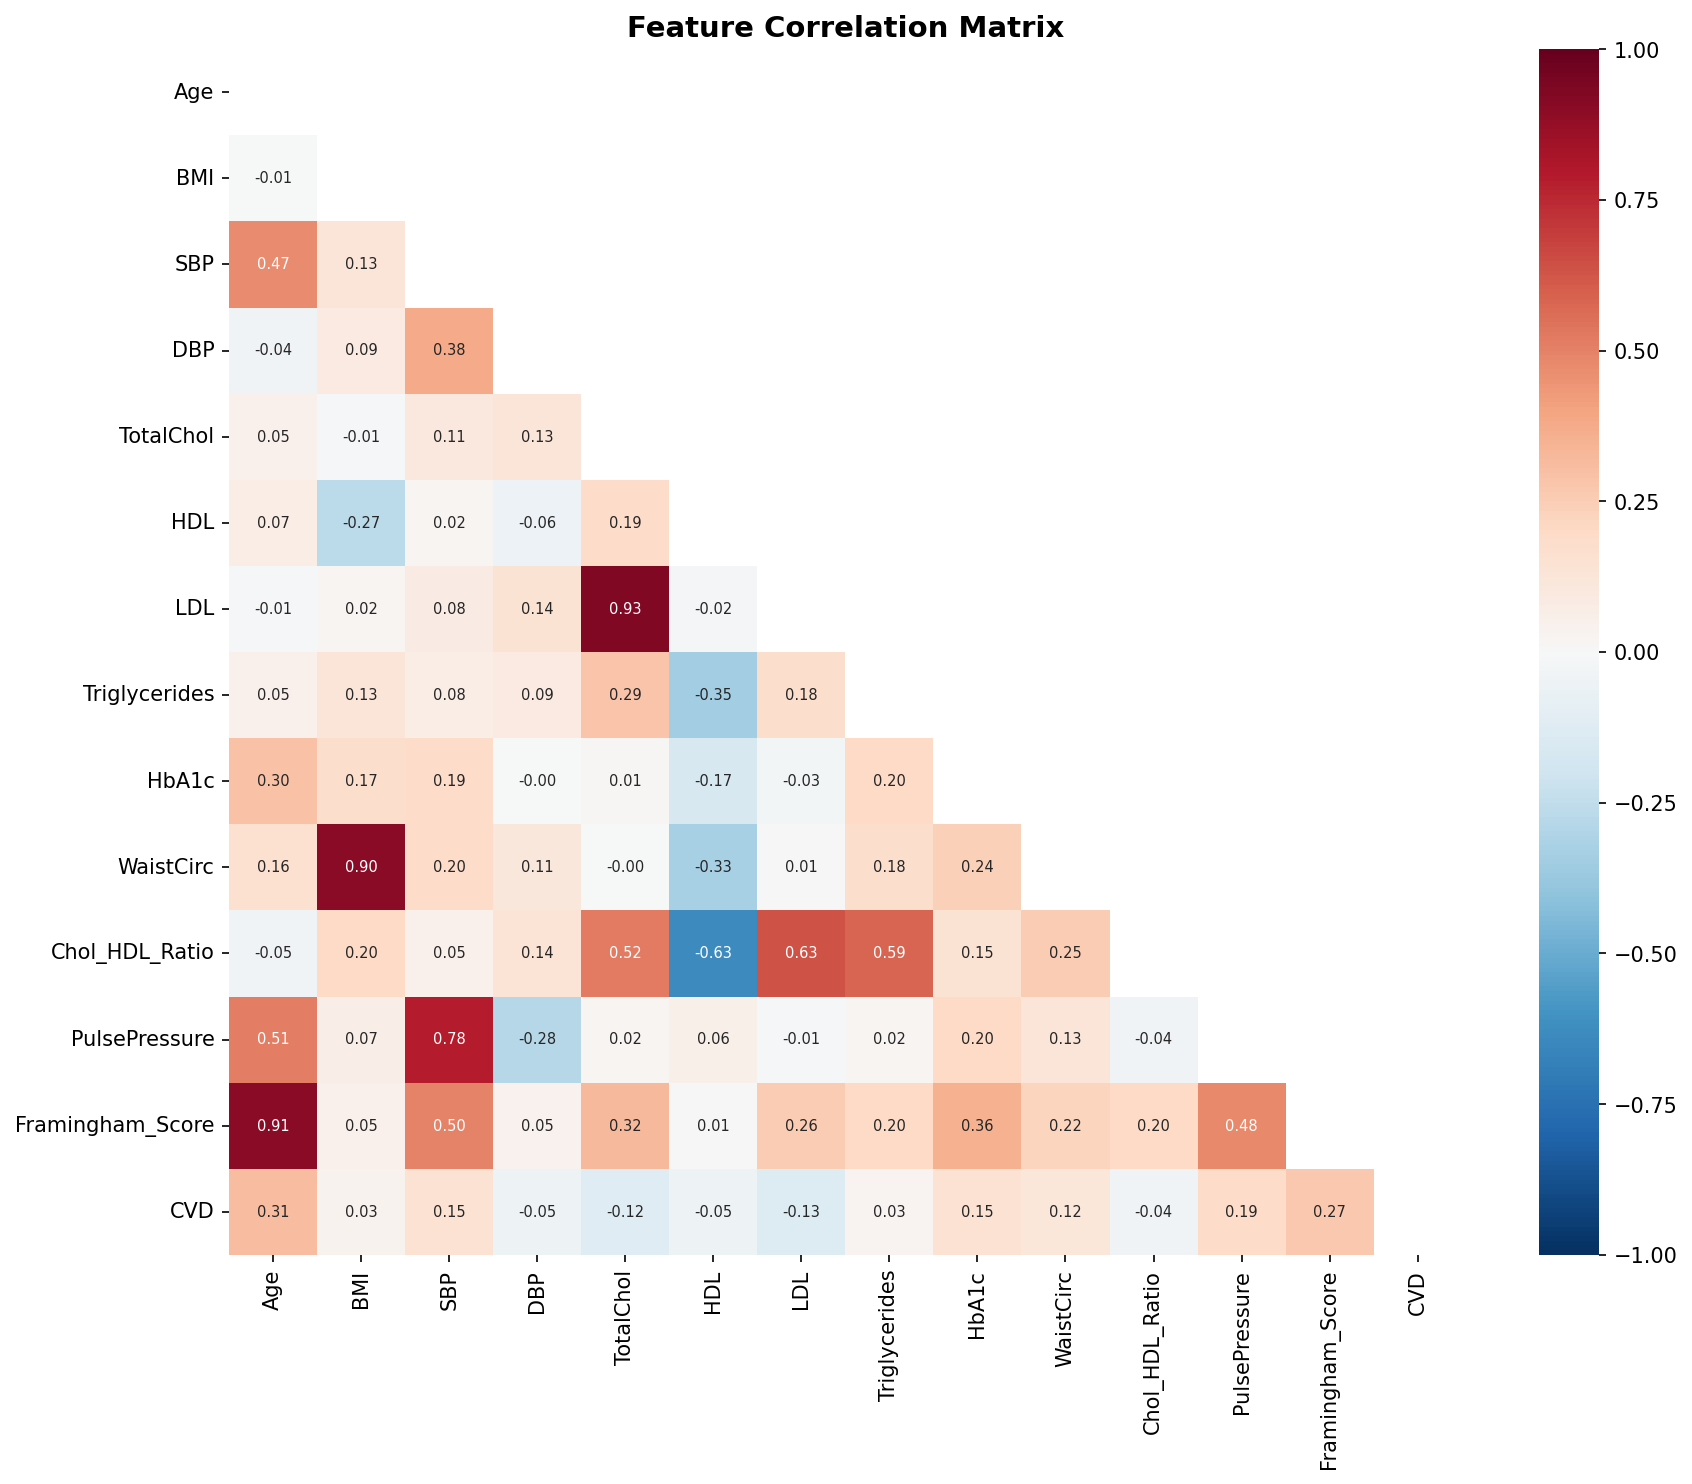
Pairwise feature correlations — Age and Framingham Score show highest correlation with CVD outcome
SHAP Interpretability
Every prediction explained — globally and per-patient — using TreeExplainer on XGBoost
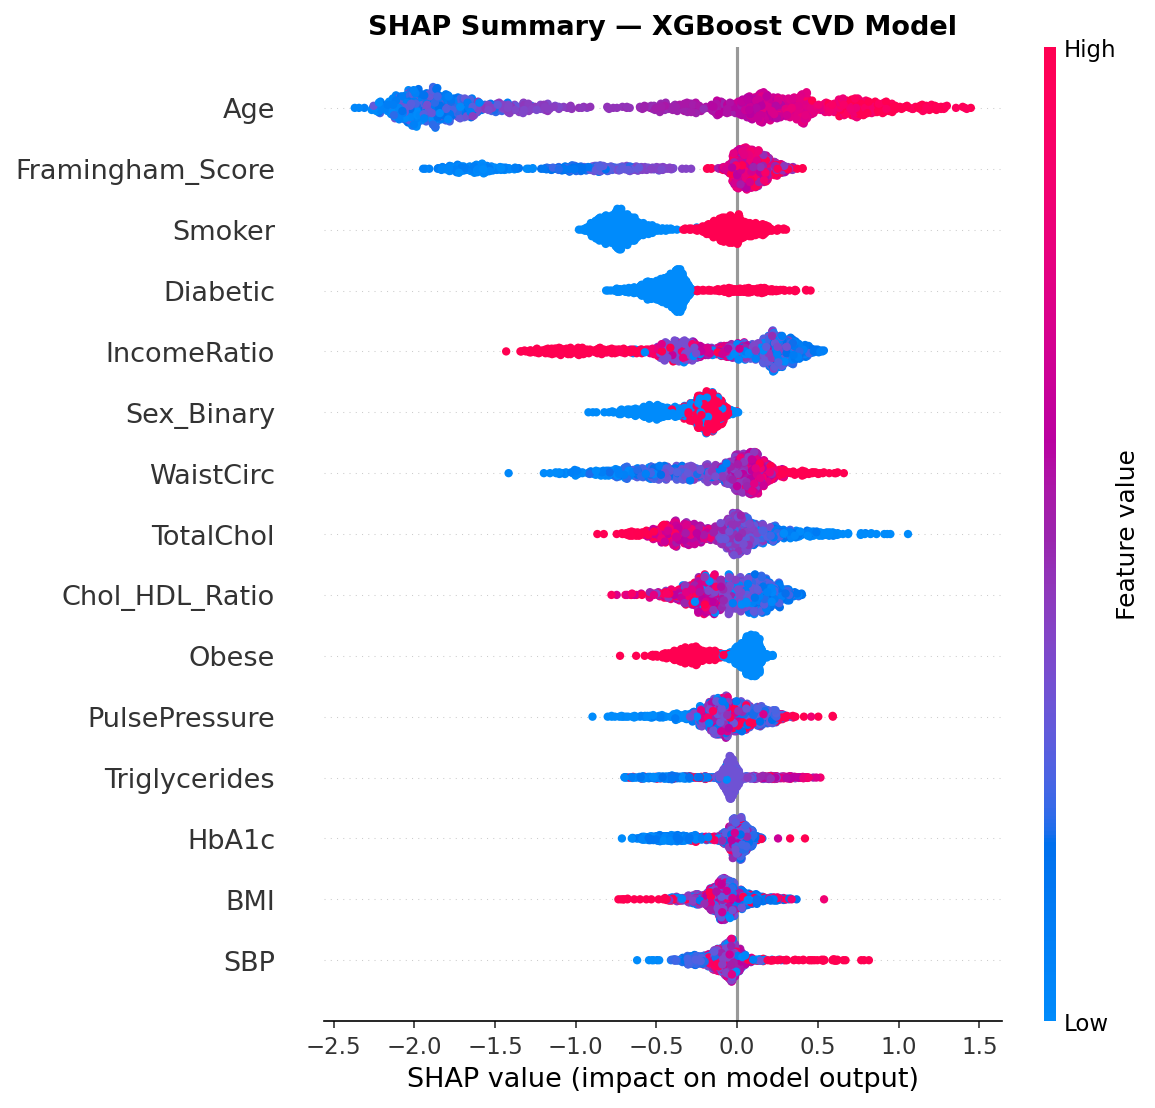
SHAP summary dot plot — each dot is one patient; red = high feature value, blue = low
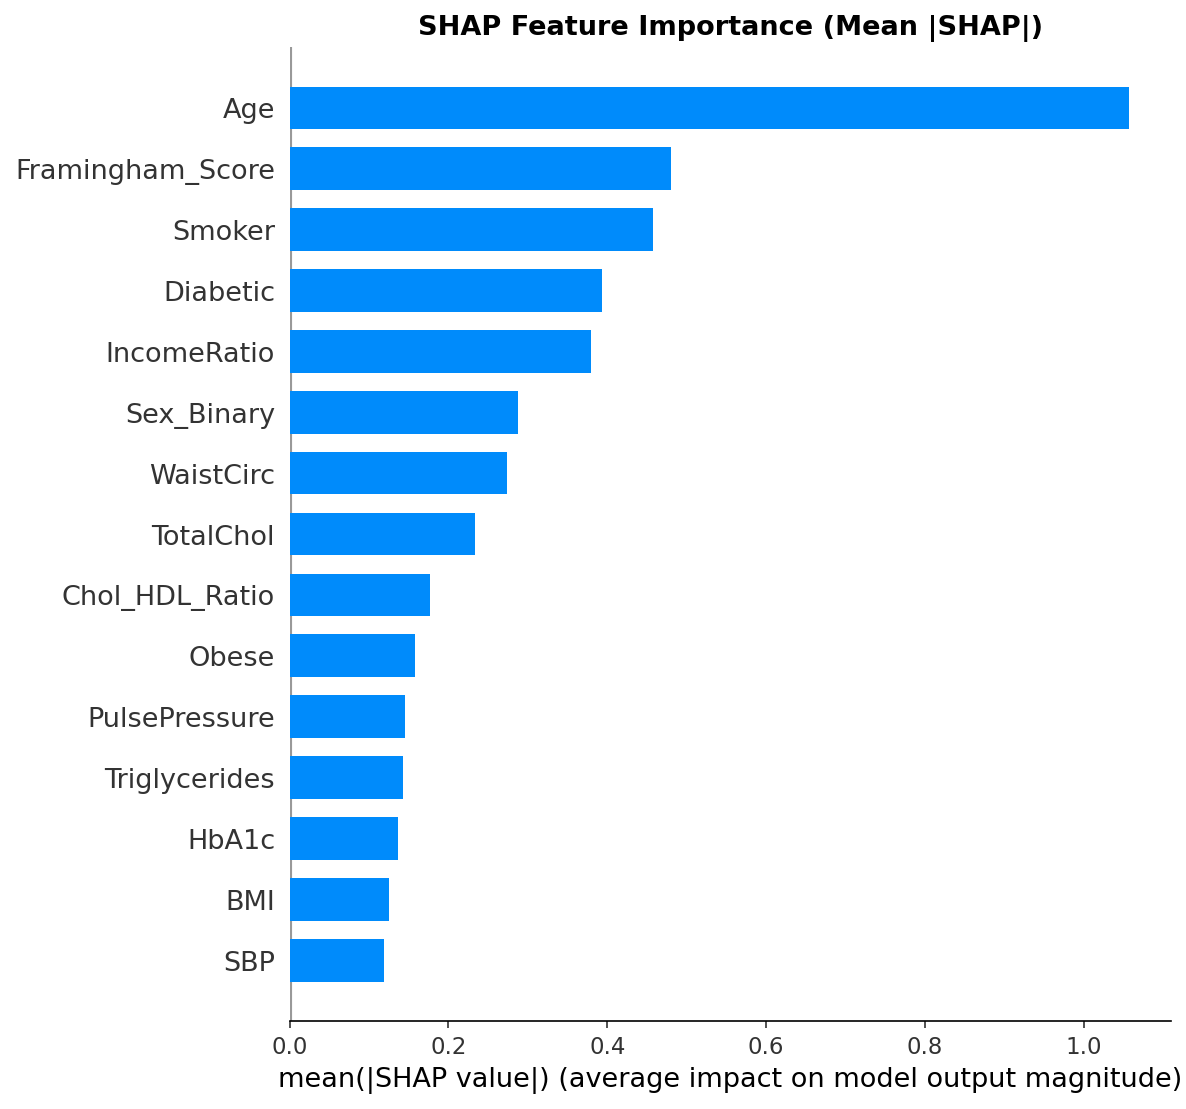
Mean |SHAP| global importance — Age and Framingham Score dominate; WaistCirc ranks 3rd
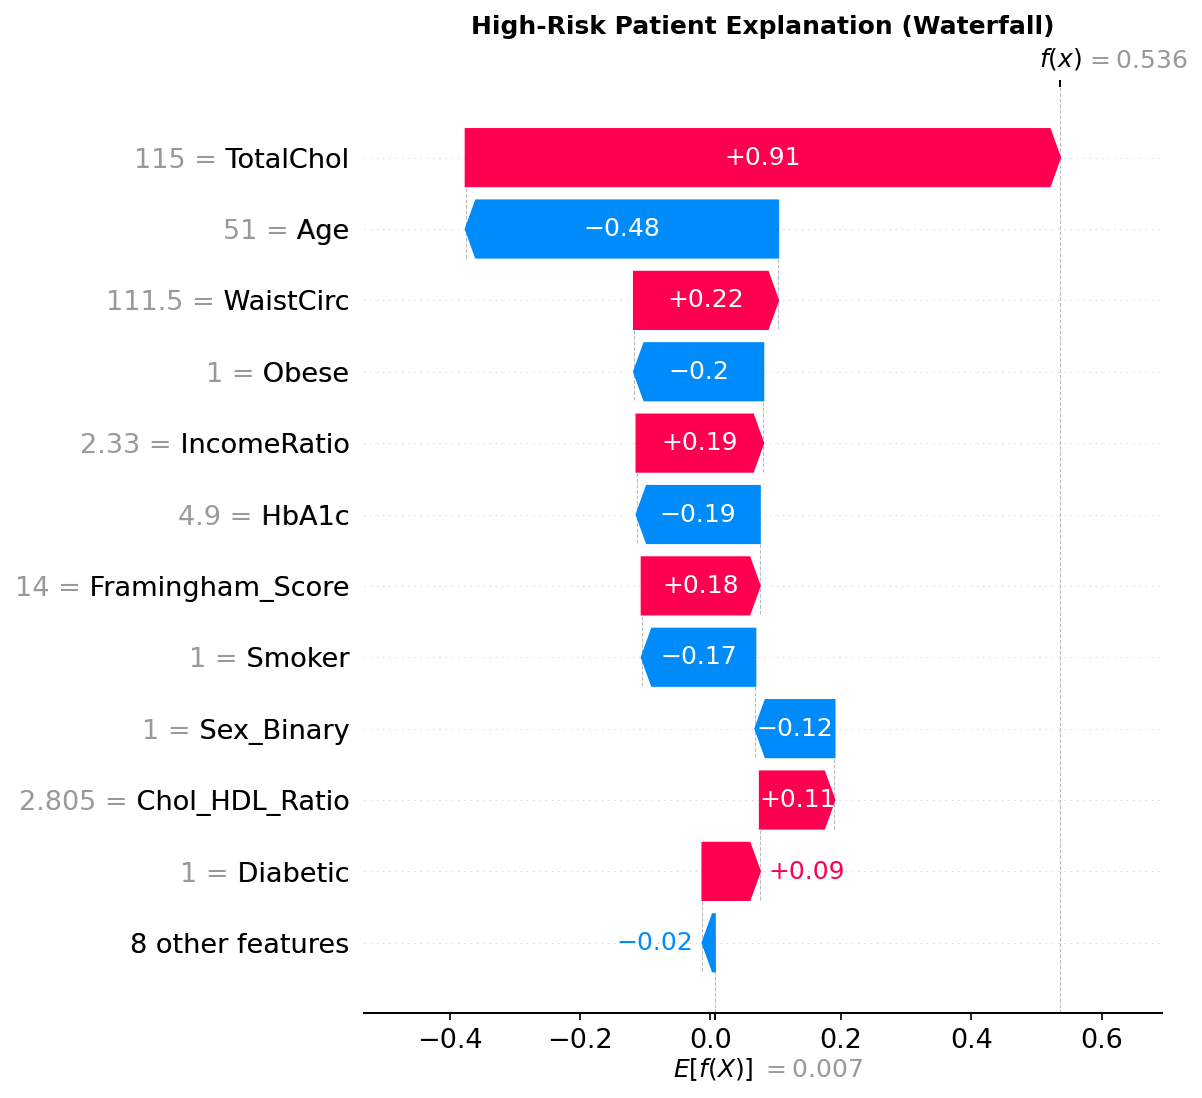
Per-patient waterfall: a 63% probability patient — Age (+0.33) and Framingham Score (+0.29) drive the prediction up
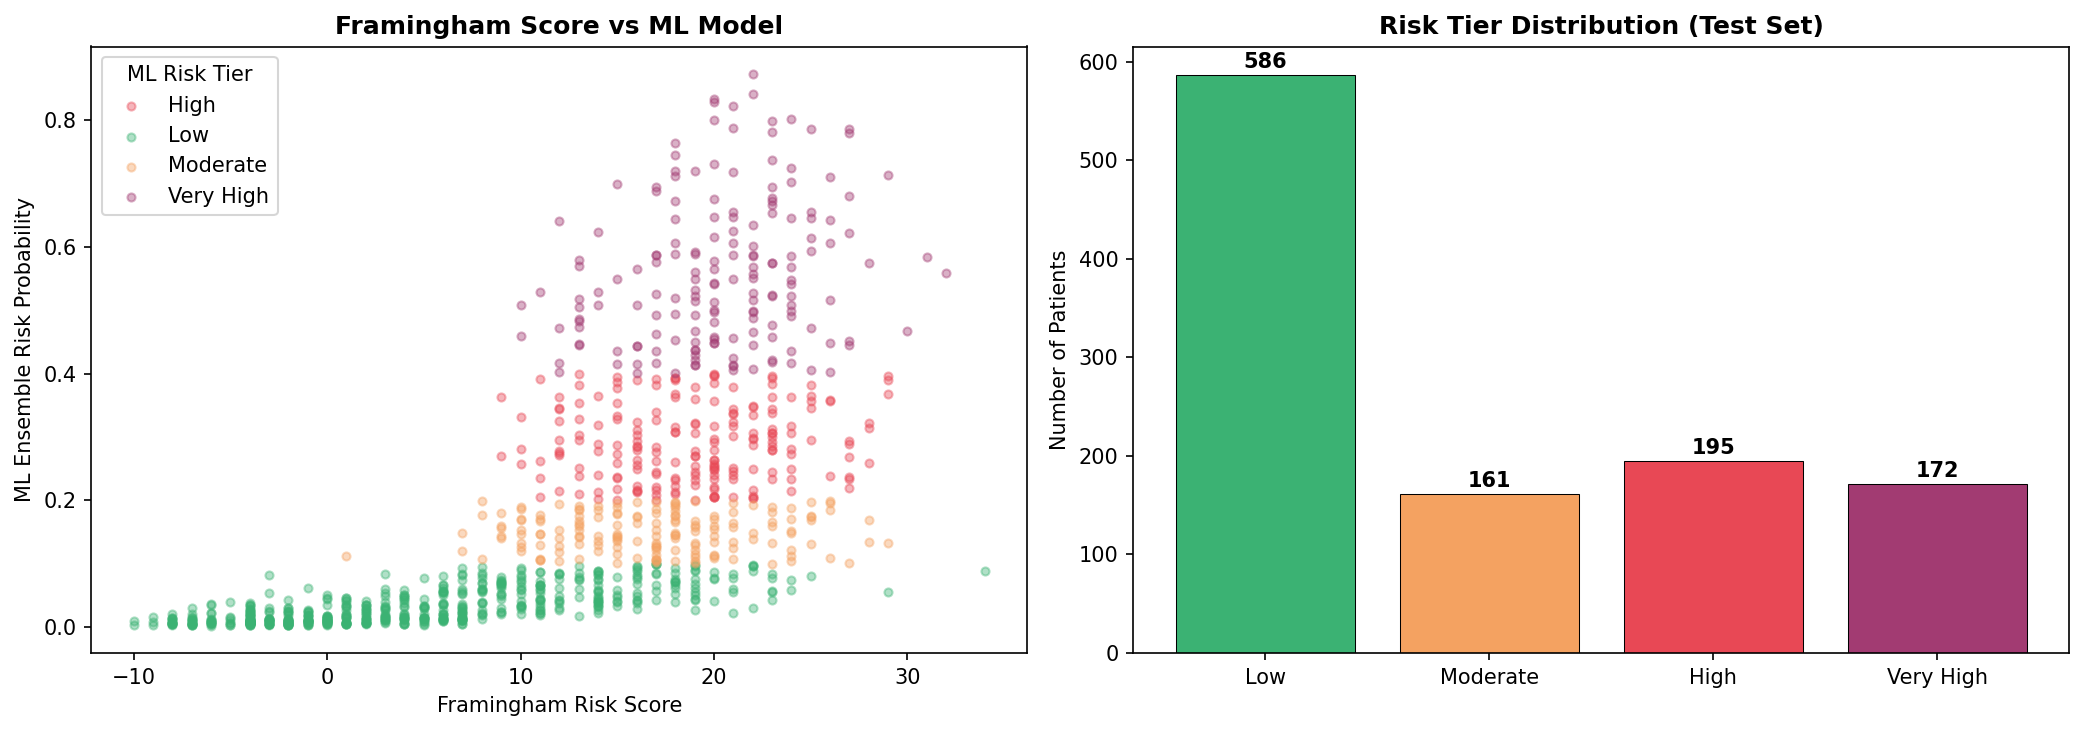
Risk Stratification
Patients are stratified into 4 clinical tiers based on ensemble probability
Low Risk
2.6%
Prob <10% | n=586 patients Actual CVD rate: 2.6% — confirms model safety